Speed Time Graph
A Speed time graph represents the movement of an object from its initial position to its final destination
« Previous Next »How to solve a Speed time graph with examples
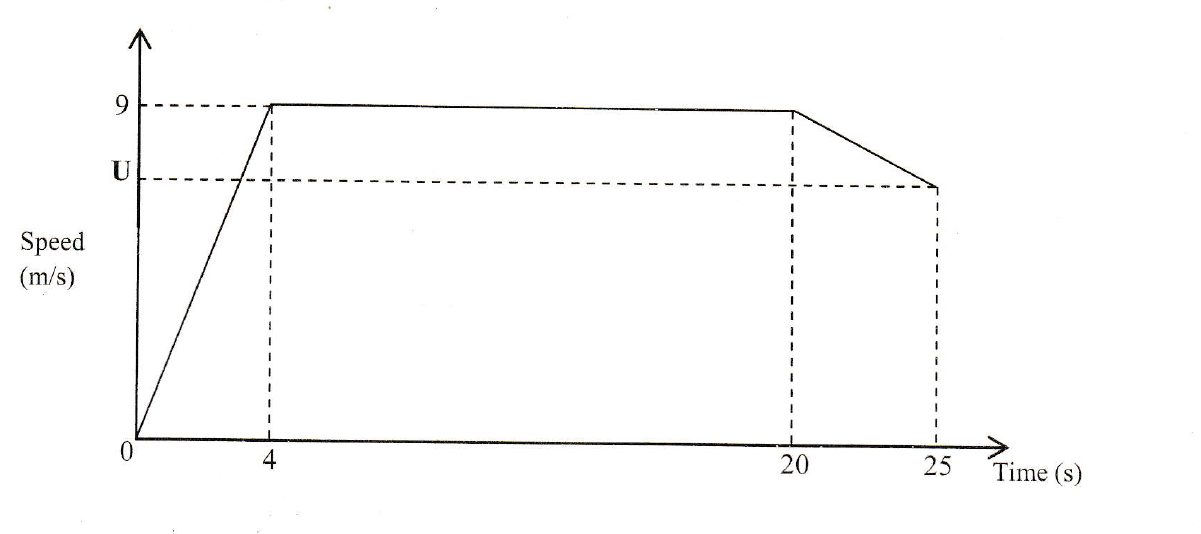
A sprinter rulls a race of 200m. Her total time for running the race is 25 seconds ending at U m/s. Below is a sketch of the motion of the sprinter.

Calculate the
(a) acceleration in the first 4 seconds,
(b) distance covered in the first 20 seconds,
(c) value of U.
Solutions
(a)
Formula for Acceleration
Acceleration =
V = final velocity, U = initial velocity and t = time
V = 9, U = 0 , t = 4
Acceleration =
Acceleration =
Answer: Acceleration =
(b)
We will use a Tripezium Shape taken in the first 20 seconds to find the distance
Distance =
a = 20, b = 16, h = 9
Distance =
Distance =
Distance =
Answer: Distance =
(c)
From 20 to 25 second we have another Tripezium shape, hence with the distance we have found for the first 20 second in (b) we can subtract it into the total 200m inorder to find the distance between 20 to 25 seconds
Distance = 200 - 162
Distance = 38
Distance =
Distance = 38, a = 9, b = U, h = 5
38 =
38 =
Cross muiltiply
76 =
= 76
= 76 - 45
= 31
Answer:
speed-time graph Example
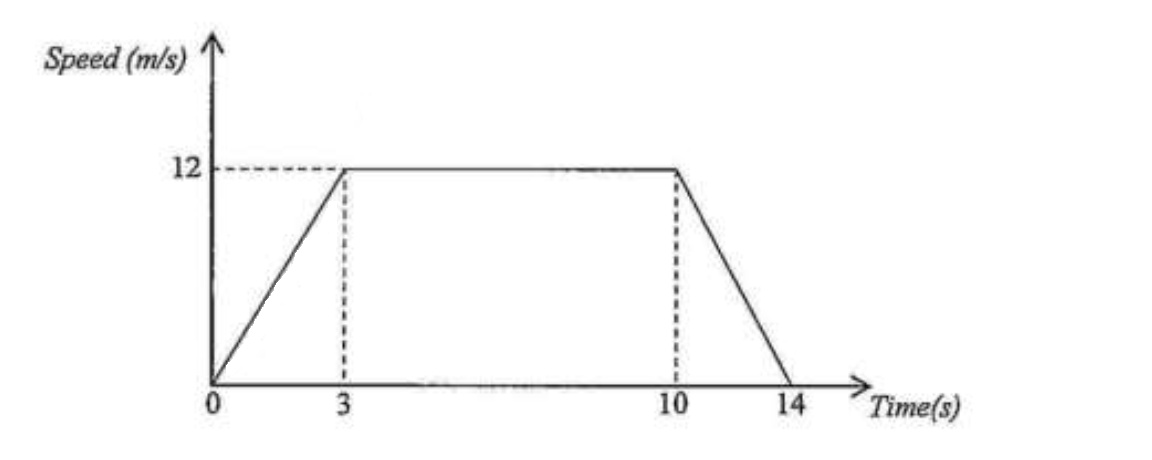
The diagram below shows the speed-time graph of a 100m sprinter who accelerates uniformly for 3 seconds until he reaches a speed of 12m/s. He maintains the speed for 7 seconds and then uniformly retards for a further 4 seconds and comes to a stop.

Calculate the
(a) acceleration during the first 3 seconds,
(b) retardation at the end of his race,
(c) distance he covered in the last 4 seconds.
Solutions
(a)
Acceleration =
V = 12, U = 0, t = 3
Acceleration =
Acceleration =
Answer: Acceleration =
You can also use the gradient formula to find the acceleration aas shown below
Gradient =
We have the following co-ordinates (0, 0) (3, 12)
X1 = 0, X2 = 3, Y1 = 0, Y2 = 12
Gradient =
Gradient =
Gradient =
Therefore Answer: Acceleration =
(b)
retardation is a negative acceleration
Acceleration =
V = 0, U = 12, t = 4
Acceleration =
Acceleration =
Acceleration =
Answer: Retardation =
(c)
We will use the area of a triangle to find the distance in the last 4 seconds
Distance =
b = 4, h = 12
Distance =
Distance =
Answer: Distance =
How to solve a Speed time graph step by step
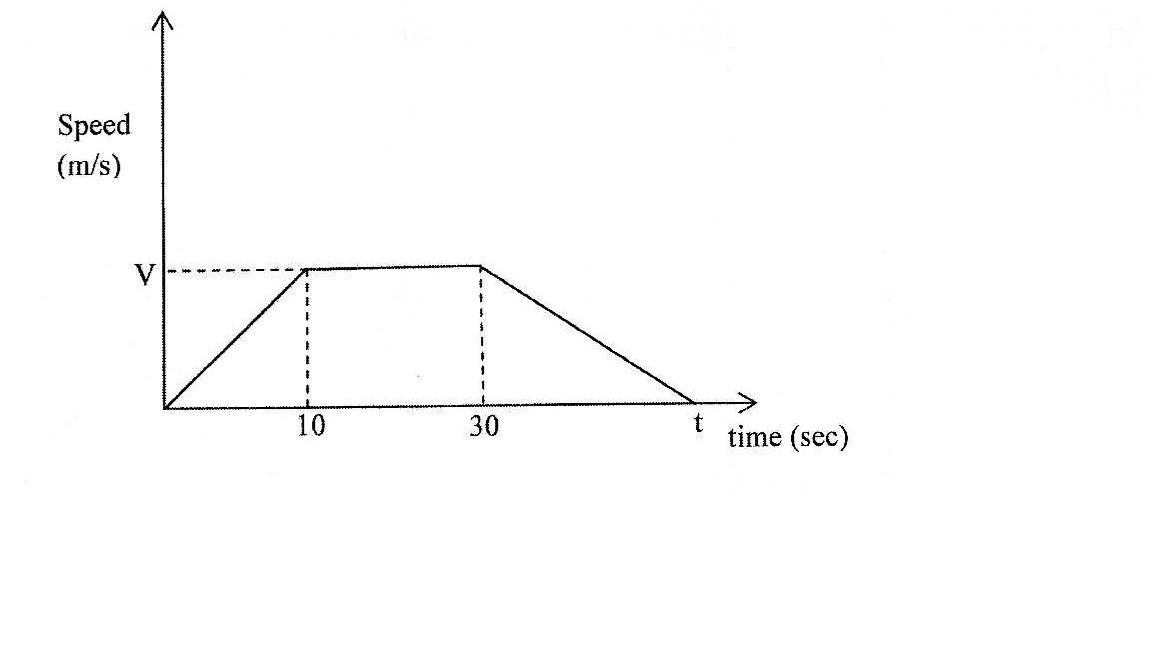
The diagram below shows the speed-time graph of a particle. the particle started off from rest and accelerated uniformly from 10 seconds. it then travelled at a constant speed of 20 seconds and then decelerated to rest.

(a) Find the speed V the particle reached if its acceleration was in the first 10 seconds.
(b) Given that the total distance covered was 750m, find the value of t in the diagram
(c) What was the speed at 40 seconds
Solution:
(a) Formula:
a =Points to note
a = acceleration
V = Final velocity or speed
U = Initial velocity or speed
t = time
Therefore a = 2, V = ? , U = 0, t = 10
2 =
2 =
Answer: V = 20m/s
(b)
The distance on the speed-time graph is given has 750m, therefore the formula should be made to fit on all the three segments of the diagram
Distance = Area1 + Area2 + Area3
Area1 =
Area1 =Area1 =
Area1 =
Area2 = bh
Area2 =Area2 =
Area3 =
Area3 =Area3 =
Distance = Area1 + Area2 + Area3
Points to note
Distance = 750
Area1 = 100
Area2 = 400
Area3 = 10t
750 = 100 + 400 + 10t
750 = 500 + 10t
750- 500 = 10t
250 = 10t
Answer: t = 25 s
(c)
a =Note:
a = ?
V = 0
U = 20
t = 25
a =
a =
a =
velocity =
V = at
Points to note
V = ?
a = negative sign means its retardation
t = 40-25
t = 15
velocity =velocity =
Therefore the speed at 40 seconds = 12m/s